HOW WE’RE TRACKING in Victoria

Explore CDS Vic data and see how the scheme is tracking across Victoria. Use the dashboard to view the number of containers returned, types of refund points and materials across the scheme, and more.

3.8 Billion

Containers returned via Victoria’s Container Deposit Scheme

Since the scheme began in November 2023

Average 156 Containers per transaction

Victorians have returned more than

2,678 Times

The length of the Great Ocean Road

$381.9 Million

Returned to Victorian pockets

71%

Reduction in litter across Victoria

1.3 Billion

Additional containers recycled via kerbside, public and commercial collections

Top Donation Partners
cds-dashboard-icon-hands

$4,456,325

Raised for donation partners
cds-dashboard-icon-returns

Returns across Victoria

Container returns by local government area,
since November 2023

Hume City Council 5.7% 218,087,374
Greater Geelong City Council 5.4% 205,894,774
Casey City Council 5.1% 196,006,760
Melton City Council 4.8% 181,565,737
Wyndham City Council 4.3% 163,433,077
Brimbank City Council 3.5% 132,357,813
Ballarat City Council 3.3% 125,496,198
Monash City Council 3.2% 122,768,279
Greater Dandenong City Council 3.2% 122,640,740
Hobsons Bay City Council 3.1% 118,813,312
Whittlesea City Council 3% 115,966,650
Greater Bendigo City Council 2.8% 106,276,610
Frankston City Council 2.7% 103,089,154
Knox City Council 2.7% 102,472,235
Mornington Peninsula Shire Council 2.5% 94,761,348
Latrobe City Council 2.2% 83,700,655
Kingston City Council 2.2% 83,077,205
Greater Shepparton City Council 2% 74,812,036
Merri-bek City Council 2% 74,538,087
Mildura Rural City Council 1.9% 73,334,477
Cardinia Shire Council 1.8% 69,197,226
Darebin City Council 1.7% 65,024,323
Whitehorse City Council 1.6% 61,805,809
Yarra Ranges Shire Council 1.4% 53,365,554
Baw Baw Shire Council 1.4% 53,238,623
Warrnambool City Council 1.3% 49,151,522
Campaspe Shire Council 1.2% 45,620,424
East Gippsland Shire Council 1.2% 44,092,939
Wodonga City Council 1.1% 43,184,775
Banyule City Council 1.1% 42,025,478
Bass Coast Shire Council 1.1% 41,404,670
Wellington Shire Council 1.1% 41,094,040
Mitchell Shire Council 1.1% 40,483,064
Maribyrnong City Council 1% 38,965,784
Maroondah City Council 0.9% 35,043,505
Wangaratta Rural City Council 0.9% 35,003,104
Horsham Rural City Council 0.9% 33,431,734
Moonee Valley City Council 0.9% 33,377,009
Melbourne City Council 0.8% 30,635,558
Manningham City Council 0.8% 28,979,402
Port Phillip City Council 0.7% 28,334,307
Bayside City Council 0.7% 28,066,881
Swan Hill Rural City Council 0.7% 27,005,067
Moira Shire Council 0.7% 26,214,899
Glen Eira City Council 0.6% 24,186,939
Colac Otway Shire Council 0.5% 19,807,526
Moorabool Shire Council 0.5% 19,698,801
Glenelg Shire Council 0.5% 17,827,899
Benalla Rural City Council 0.4% 16,484,728
Central Goldfields Shire Council 0.4% 15,632,221
Boroondara City Council 0.4% 15,299,995
Surf Coast Shire Council 0.4% 15,229,172
Northern Grampians Shire Council 0.4% 14,791,353
Southern Grampians Shire Council 0.4% 14,212,208
Macedon Ranges Shire Council 0.3% 12,554,082
Corangamite Shire Council 0.3% 12,278,112
Ararat Rural City Council 0.3% 12,174,753
Mount Alexander Shire Council 0.3% 10,680,014
Yarra City Council 0.3% 10,553,329
South Gippsland Shire Council 0.3% 10,260,639
Mansfield Shire Council 0.3% 10,107,451
Murrindindi Shire Council 0.2% 7,884,969
Hepburn Shire Council 0.2% 6,548,608
Gannawarra Shire Council 0.1% 5,704,775
Moyne Shire Council 0.1% 5,063,922
Strathbogie Shire Council 0.1% 4,789,291
Golden Plains Shire Council 0.1% 4,617,361
Yarriambiack Shire Council 0.1% 4,608,798
Stonnington City Council 0.1% 4,576,024
Nillumbik Shire Council 0.1% 4,248,332
Towong Shire Council 0.1% 4,171,678
Hindmarsh Shire Council 0.1% 4,013,119
Pyrenees Shire Council 0.1% 3,795,326
Loddon Shire Council 0.1% 3,790,040
Alpine Shire Council 0.1% 3,334,770
Buloke Shire Council 0.1% 3,279,217
Indigo Shire Council 0.1% 2,173,208
West Wimmera Shire Council 0% 751,227
Borough of Queenscliffe Council 0% 322,884

What's Being Returned

A look at the different materials people are returning through the scheme
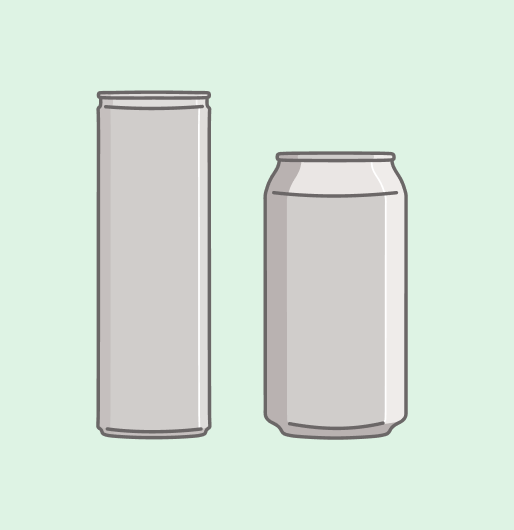
49.6%

Aluminium
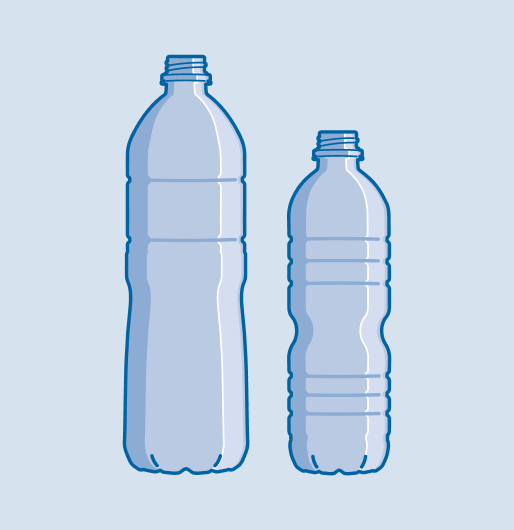
30.7%

Plastic
2%

Liquid paperboard

16.6%

Glass

Access to refund points
634

Live Refund points across Victoria

294

Reverse Vending Machines
68

Depots
272

Over-the-counter

1,080 beverage suppliers registered

supporting the delivery of Victoria’s Container Deposit Scheme

Get started today

Joining the Container Deposit Scheme is easy. Collect, return, and earn — while making a positive impact for Victoria’s future.

Impact statistics are current as of November, 2026

Dashboard statistics are updated regularly to reflect the latest available CDS Vic scheme data since the Scheme’s start date (1 November 2023) to the latest available data. They are updated regularly as new data becomes available.

The length of the Great Ocean Road in drink containers is calculated using the length of the road (243km) compared with the potential length if all eligible drink containers returned to CDS Vic since 1 November 2023 were arranged end-to-end, lying flat. The heights of those containers used for this calculation are the median heights of all drink container types accepted by CDS Vic (eg, plastic bottles, aluminium cans, glass bottles etc). This figure is updated weekly.

The percentage reduction in litter is calculated by EPA Victoria and updated upon notice from the EPA to CDS Vic.